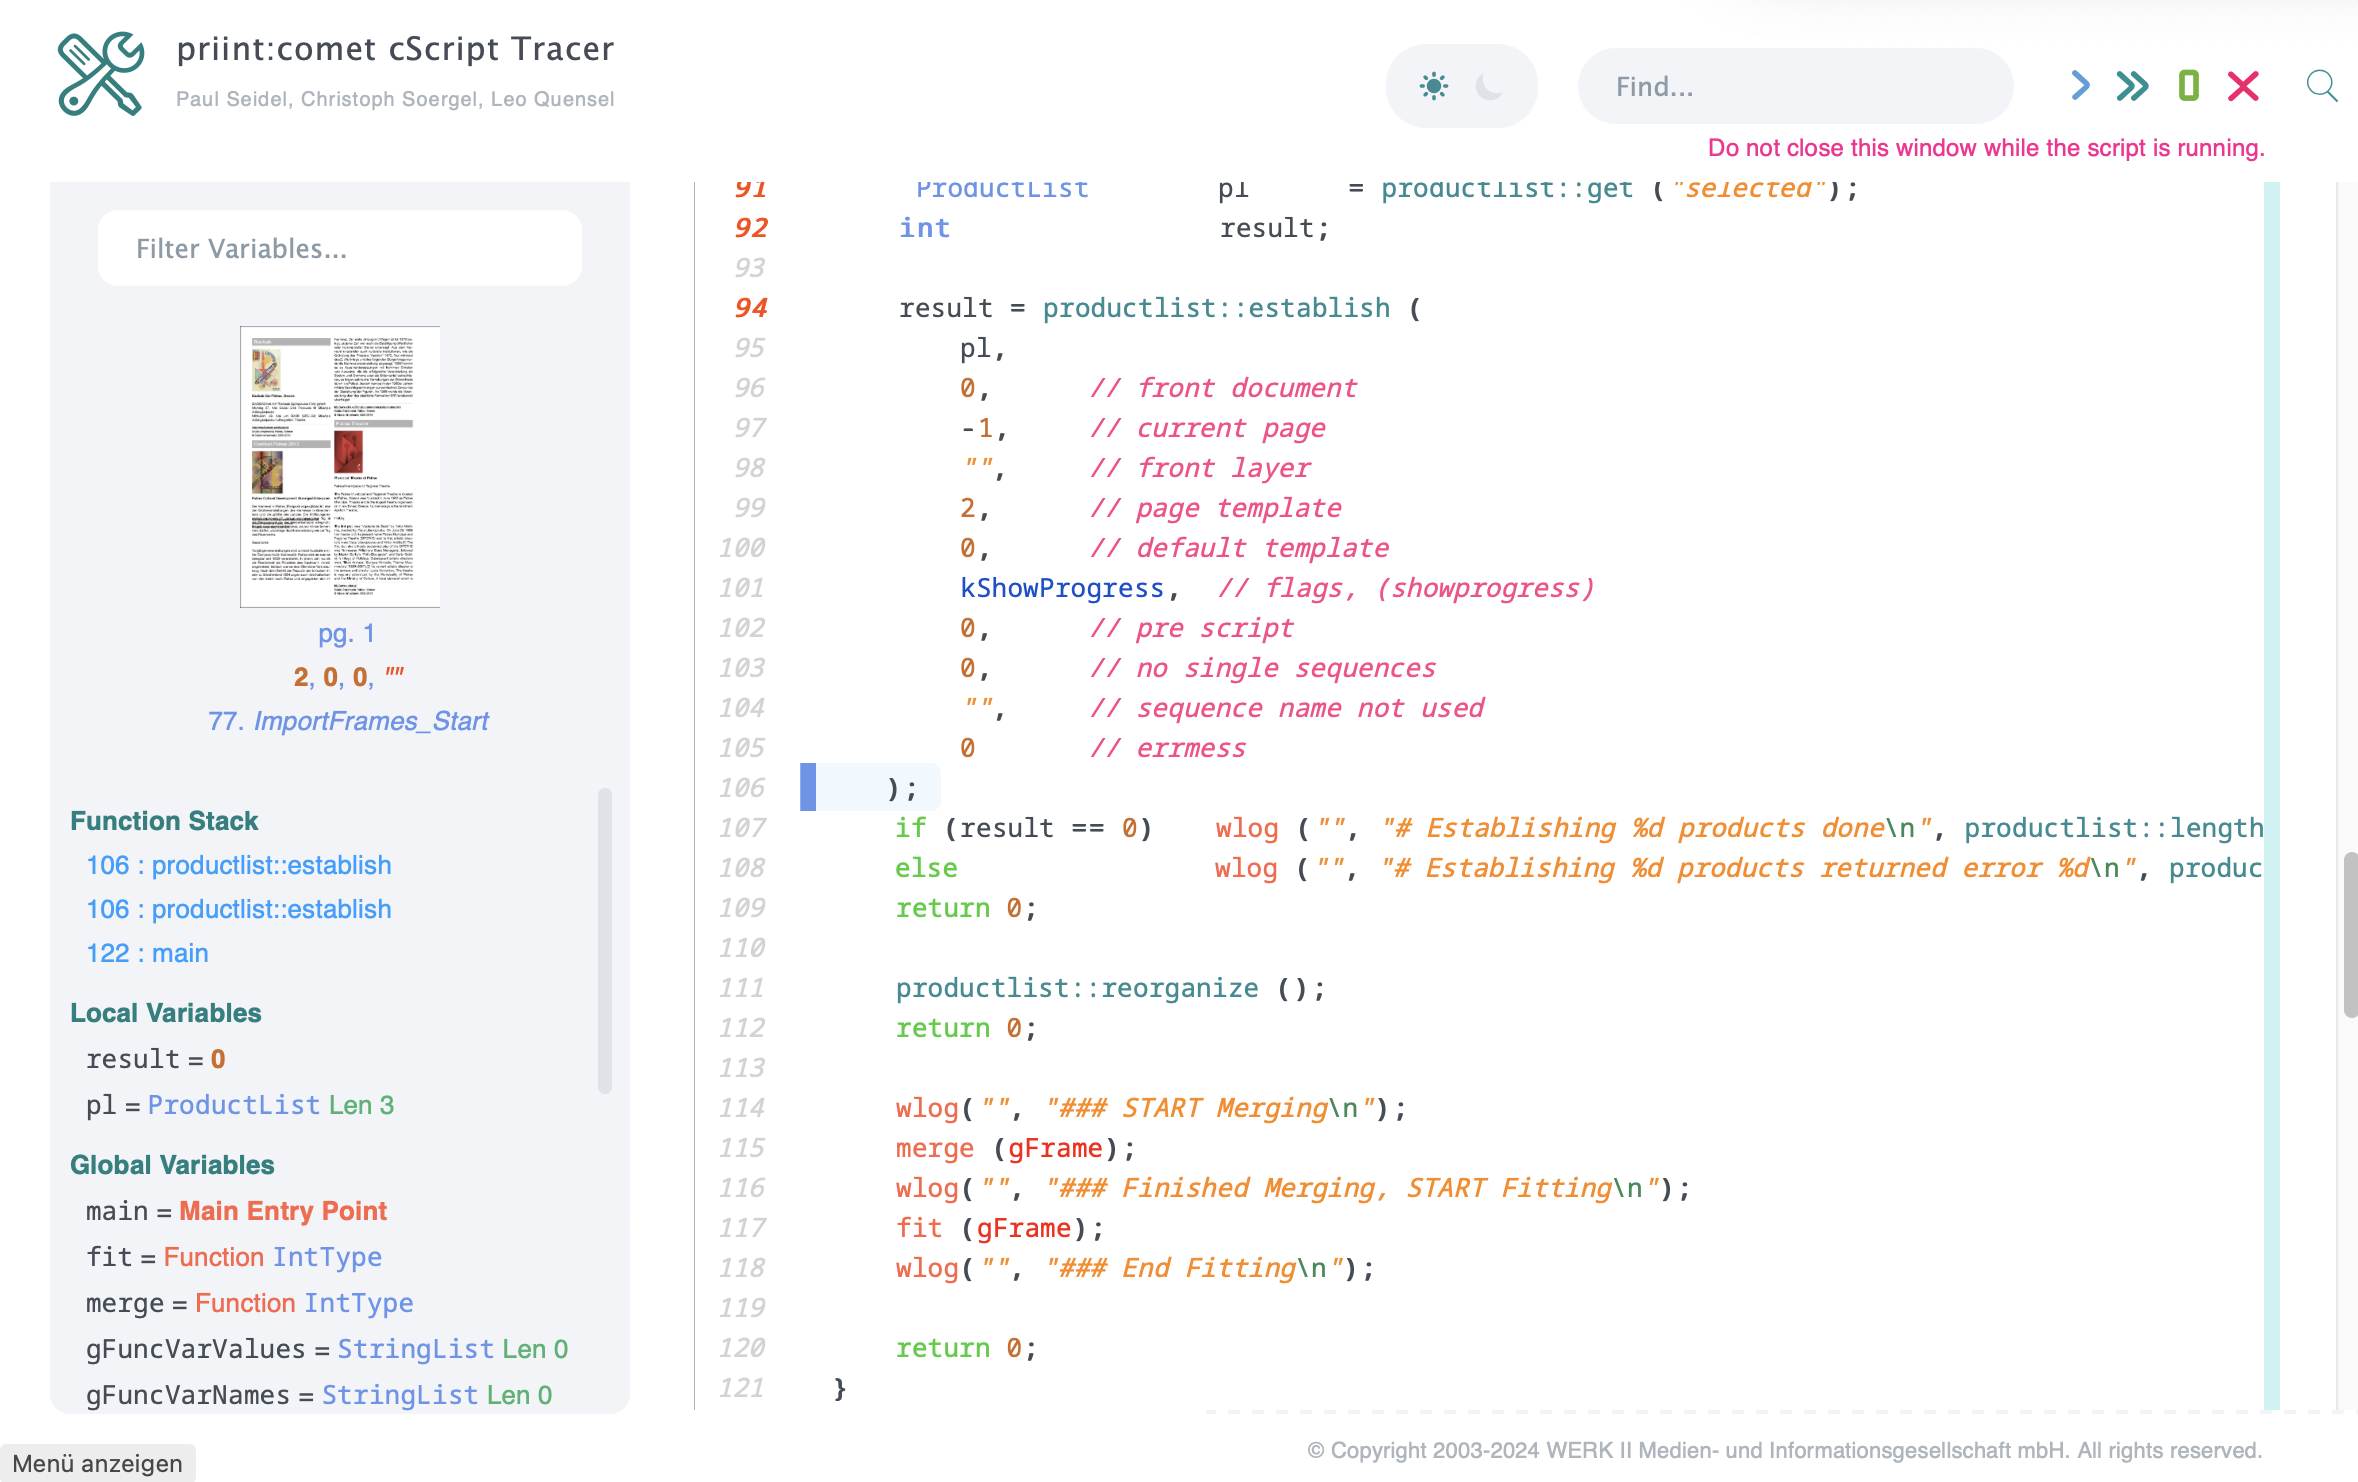
Welcome to the priint:comet cScript Tracer!

The cScript Tracer enables the function calls and the product build-up of a cScript to be traced.
and the product structure of a cScript. The tracer is started in the web browser of your computer
and takes over the control of InDesign® until the end of the script.
Suggestions for using the tracer are always welcome.
But please note, however, that the tracer is expressly excluded from WERK II support.
Two steps are required to track the execution of a script:
Preparation of the script
Activation of the tracer in InDesign
The tracer is activated with the following instruction (in exactly this notation and including the one space!):
#pragma debug ["Debug options" ]
The #pragma debug statement
must not be on the first line<7span> of the script. Specifying the debug options is optional.
A priint:comet developer license is required for tracing
and tracing must be started in the current InDesign® session (see here).
If tracing is not activated or no developer license is available,
the #pragma debug will be ignored!
The Debug Options may be missing or empty (""). The following settings are supported:
To set breakpoints, simply enter the line numbers of the script instructions into the options string.
The line numbers do not have to be sorted. Multiple line numbers are separated by spaces.
Stop tracing automatically at script lines 12, 23 and 45 during fast forward:
#pragma debug "12 45 23"
To enable the tracer to stop at some certain build steps for instance
by a call to productlist::establish,
insert a sub-string with the introduction estab: into the debug options.
To avoid conflicts with the double quotation marks, enclose this string
in single quotation marks:
#pragma debug "12 45 23 'estab:...' "
estab: supports the following specifications. The individual sub-options are separated by spaces (not commas).
For better readability, you can insert line delimiters here.
Please note, however, that line delimiters in strings must be marked with a \ at the end of the line!
id id1 id2 id3 \"stringid\" : Only stop at the product with the specified ID only.
products \"condition\" : Stop only at products that meet the specified condition. The following
product values are accepted in the condition:
id
id2
id3
stringid
pageitemid
classid
pagetype
type
info1
info2
applyinfo1
applyinfo2
Attention: We are running out of quotation marks for string values (stringid, info1, info2) here.
Therefore, use << and >> as quotation marks in the sub-condition, e.g. stringid like <<Accessories%>>.
imported : Stop after each successful insertion of a product or a continuation of a product.
buildsupport \"condition\" :
Stop when executing a Build Support Script.
The following values are accepted in the condition:#Aufbauhilfe">Aufbauhilfe.
Folgende Werte werden in der Bedingung akzeptiert:
previews \"condition\" : Stop at every preview that fulfills the specified condition.
The following values are accepted in the condition:
index : 1-based index of the preview.
If the script, the build-up and/or product data are changed, it is very likely that the preview indexes will also change.
It therefore only makes sense to specify indexes for a (sufficiently large) range and/or a specific test case.
name : Name of the preview. Attention: We are running out of quotation marks here.
Therefore, please use << and >> as quotation marks in the sub-condition here,
for example name like <<%Oversets%>>
To determine the name and index of a preview, you should execute your script once with an empty previews condition.
In the example, the tracer stops at the product with ID 2 at every preview whose names begin with 'ImportFrame'
and for all calls to the build-support with 2 (kCheckSizeAfter).
In addition, the 'Quick Forward' stops at lines 8, 91, 92 and 94.
#pragma DEBUG "\
	92 94 \
	8 \
	'estab: id 2 0 0 \"\" \
	previews \"name like <<ImportFrames%>>\" \
	buildsupport \"situation = 2\"' \
	91 \
	"
To activate the cScript Tracer in InDesign®,
select the menu .
In the appearing dialog, enter the number of a free port on your computer.
The data traffic between InDesign® and the cScript Tracer in the browser will be handled via this port then.
Please note the following:
The menu command is only activated with a valid priint:comet developer license.
The given port must be and remain unoccupied!
The given port must be different from a possibly given port for the Python debugger.
To activate the cScript Rracer in InDesign® Server, start the server with the additional option:
-debugscript portNum
The same applies here:
The option "-debugscript is only used with a valid priint:comet developer license. Without a developer license, the option is ignored.
The given port must be and remain unoccupied!
The given port must be different from a possibly given port for the Python debugger.
If the cScript Tracer is activated,
each marked script is automatically opened in your standard browser via the set port and can be traced from there.
From the start of trcing until the end of the script, the control is transferred from InDesign® or InDesign® Server to the browser.
InDesign is protected from manual changes by a non-closable dialog until the end of the script.
If the browser window is closed before the end of the script, InDesign® can only be terminated by a hard shutdown!
An active Internet connection is required to start the cScript tracer!
The following browsers were tested on Mac and Windows:
Safari
Google Chrome
Firefox
In contrast to other debuggers, the cScript Tracer only stops at functions calls.
Use the buttons at the top right of the browser window to control the tracing:
 : (Forward) Executing the current function
 : (Fast Forward) Execute until the next breakpoint or the end of the current product setup
 : (Run) Ausführen bis zum Ende des Skripts bzw. dem Ende des aktuellen Produktaufbaus
 : (Cancel) Skript/aktuellen Produktaufbau abbrechen.
Here you can find more information about Breakpoints and tracing product build-ups.
The current local and global variables are displayed on the left-hand side of the browser window.
Rollovers open further details. Here is a screenshot with the details of gFrame:

|
The most important information of the respective objects is displayed in the details.
The calculation and implementation of the details are quite time-consuming.
Not all data types are therefore fully implemented in the current version.
To enter the details, please use the small red triangle at the top left of the details.
Images and URLs and the details can be opened in other browser windows.
Please note that images from so-called media proxy URLs
cannot be opened here - but that is exactly what you wanted to achieve with these URLs.
|
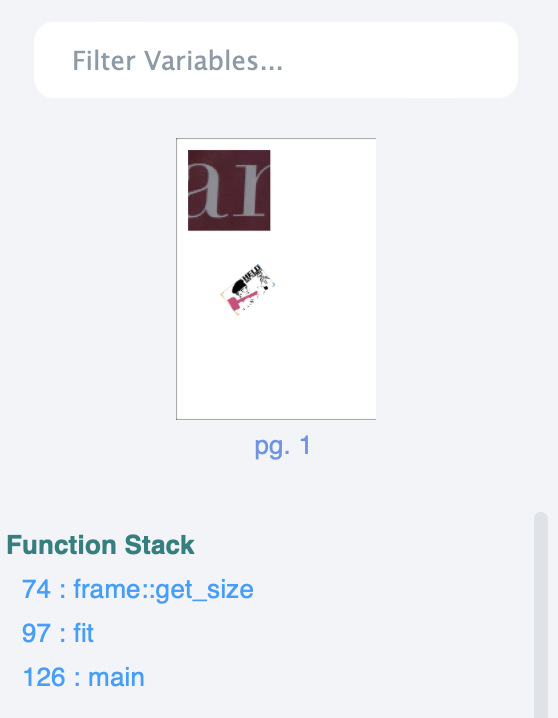
The stack of the current function calls is shown under the heading Function Stack:

|
With mouse rollovers, you can see the respective call parameters of the function calls.
When the function names are clicked, the browser window is scrolled to the function call in the script and the corresponding
line is highlighted by flashing briefly. This does not change the call sequence in the script.
|
Please note the following restrictions:
| Category |
Description |
Implementation planned? |
| Variable Assignments |
Value assignments to variables during execution are not supported.
|
>No |
| Includes |
Functions from Includes are treated as global cScript functions.
It is currently not possible to jump to the source code of these functions.
|
Yes |
| Local Breakpoints |
Manual setting of breakpoints at execution time is currently not supported.
|
Yes |
| Nested Tracers |
Nested tracing is not supported. If a tracer is active, tracings requests from other scripts are ignored.
In particular, this means that if a build script is debugged, debug requests from placeholder scripts are ignored.
|
No |
 : (Forward) Executing the current function
 : (Fast Forward) Execute until the next breakpoint or the end of the current product setup
 : (Run) Ausführen bis zum Ende des Skripts bzw. dem Ende des aktuellen Produktaufbaus
 : (Cancel) Skript/aktuellen Produktaufbau abbrechen.


